
Methodology
Overview:
The Coverage-QoE / Mobile Traffic / Digital Divide Report has been designed as a tool for telecom professionals to gain insights into a smartphone user's quality of experience and mobile traffic availability. This is done by analyzing billions of crowdsourced RF and throughput data points by location using the M2Catalyst proprietary Coverage-QoE algorithm. Mobile Traffic was also analyzed to determine the percentage of mobile connections by network technology (2G/3G/4G/5G-NSA/5G-SA). The quality of coverage and available network traffic are two factors that contribute to the Digital Divide.
Data Source and Description:
M2Catalyst crowdsources mobile network performance data from our app user base of millions of mobile consumers worldwide. Utilizing a data set that is collected from a diverse range of users and locations is superior to other sources due to the following reasons:
Real-World Insights: Unlike controlled, lab-based tests, crowdsourced data offers real-time feedback from actual users in genuine scenarios. This reflects the true performance users experience on a daily basis.
Geographical Breadth: Crowdsourcing draws data from numerous locations, covering a broader geographic span than most dedicated test teams can. This means remote, rural, urban, and even transitional areas (like highways) can be monitored.
Device Diversity: With users employing a vast array of devices with different capabilities, crowdsourcing gives insights into how a network performs across multiple device types and models.
Cost-Effective: Gathering data from users who are already using the network eliminates the need for costly, specialized equipment and field testing teams.
Volume & Continuity: Crowdsourced data collection amasses a vast volume of data points continually, allowing for real-time monitoring and trend identification.
Dynamic Conditions: This data reflects network performance under various conditions, including peak usage times, different weather conditions, and during specific events.
Unbiased Data: Since it's sourced from a diverse user base, it is less prone to biases that might arise from controlled, predetermined tests.
Data for this report was collected in each country between July1 and December 31st, 2024. The data was authenticated (coming from a known host application) and properly formatted. Next, data containing non-typical values or anomalies were filtered prior to storing. During export and processing of the data, records with values outside valid ranges for RF parameters were removed.
Data Depth:
To ensure a detailed and exhaustive view, we rigorously analyze every 800m x 800m location where M2Catalyst has pinpointed distinct network performance attributes including locations that register no signal. This extensive process encompasses the evaluation of billions of mobile network performance measurements produced across the entire service area for all mobile operators.
Both the Coverage-QoE and Mobile Traffic Analysis in this study are proprietary to M2Catalyst and designed to gain new insights into the global reach of mobile broadband, from a smartphone user’s perspective.
Coverage-QoE Methodology:
Proprietary Algorithm to Interpolate Throughput Speeds based on RF Conditions
Our analysis encompasses three pivotal 4G/5G radio condition parameters: RSRP, RSRQ, and SNR. To bolster the accuracy of our algorithm, a curated set of global throughput tests served as foundational data, which ensured an elevated statistical significance in subsequent interpolations. Thus, our algorithm integrates these three parameters into a multifaceted array, leading to a comprehensive evaluation of radio conditions and the anticipated Quality of Experience (QoE).
Scoring
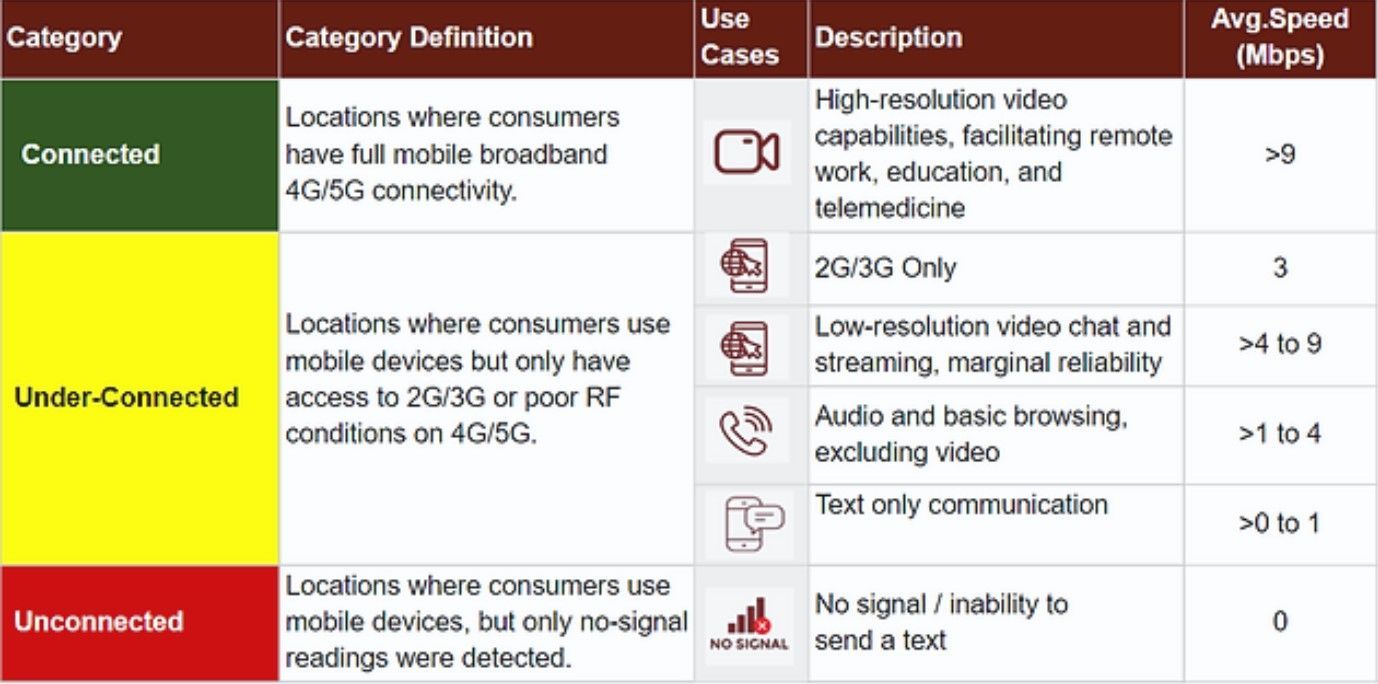
4G and 5G radio condition parameters within each 800m x 800m location bin, along with no signal data is processed using our proprietary algorithm, resulting in a comprehensive score for each 800m x 800m bin. This score mirrors the probable experience a user can anticipate within that specific vicinity, spanning a spectrum from a complete lack of signal to excellent mobile network performance (rated on a scale of 1-5). In essence, the Coverage-QoE report categorizes MNO network performance by five mobile use cases by location, determined by the calculated score.
The locations scored based on our proprietary algorithm for 4G and 5G connections were combined with locations reporting 2G and 3G connections and tabulated by five mobile use cases. The resulting data set provides a comprehensive geographic connectivity analysis for each operator per country. As a final step, the locations that comprise the data set are assigned to one of three categories: Connected, Under-Connected, and Unconnected.
Mobile Traffic Methodology:
The Mobile Traffic analysis in this report focuses on the number of connections and readings mobile devices are making with different network types (2G/3G/4G/5G-NSA/5G-SA), and situations when mobile devices are active but unable to connect to the operator network. This data is used to assess the percentage of connections served by 4G and 5G (known mobile broadband services) versus the percentage of connections on older 2G and 3G services. In contrast to the Coverage-QoE, this data set is not location-based and instead shows which network types operators have made available to users.
Awards:
As described above, the data for this study was crowdsourced from smartphone users between January and June 2023. Data sets per MNO are comprised of these users. Due to the nature of crowdsourced data, not all MNOs are equally represented.
Coverage-QoE awards have been granted to the MNOs with the highest percentage of locations reporting connected experiences, and to the MNOs with the lowest percentage of locations reporting an unconnected experience. Mobile Network Traffic awards have been granted to the MNOs with the highest percentages of devices connected to 4G or 5G combined, and to the MNOs with the lowest percentages of devices reporting no signal occurrences.