
Mobile Broadband Quality and Traffic Highlights
Mobile Quality
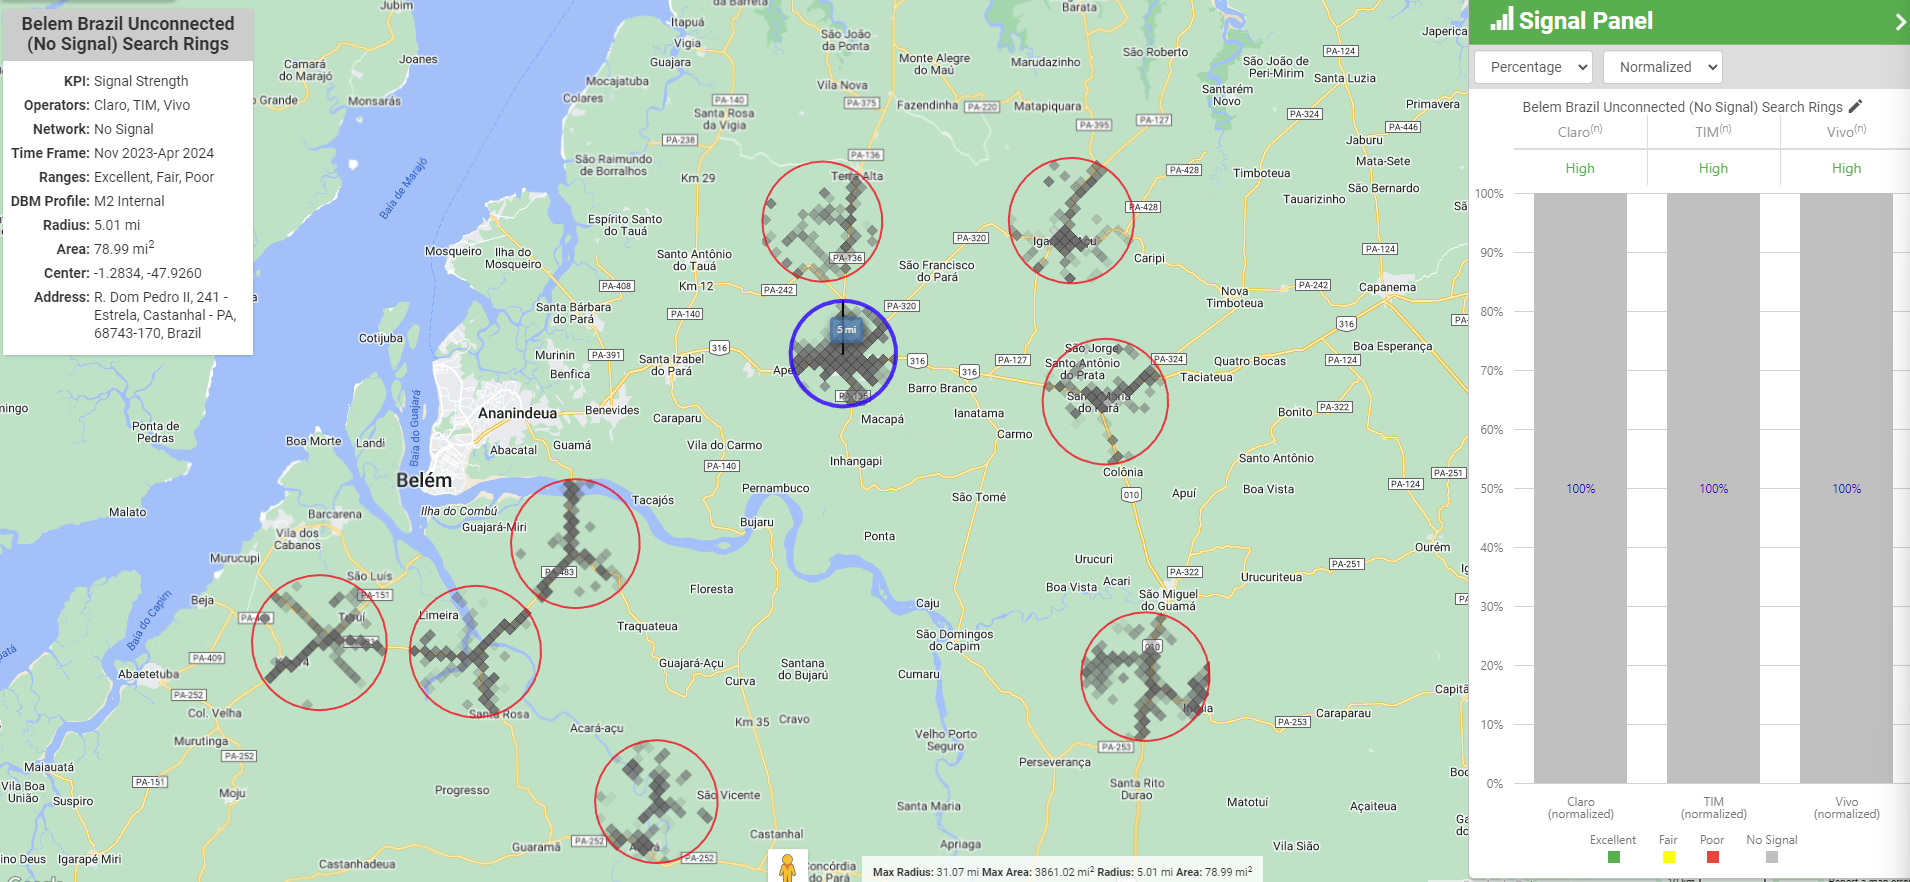
Interested in understanding the geographic areas where smartphone users face challenges accessing robust 4G/5G mobile broadband signals essential for remote work, education, and telemedicine?
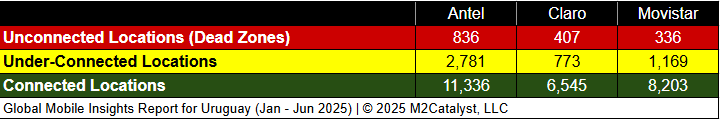
• This study identified a minimum of 836 and a maximum of 1,579 unconnected bins (Dead Zones aka Not-Spots), depending on the degree of overlap. This represents between 4% and 8% of the unique bin count (locations reporting at least one quality reading from any of the MNOs in the study).
• This study identified a minimum of 2,781 and a maximum of 4,723 under-connected bins, depending on the degree of overlap. This represents between 15% and 25% of the unique bin count.
• Mobile Broadband Quality data layers including under-connected locations where some users are experiencing poor service on a 4G network type are available as CSV exports. Coordinates and mapping of the Dead Zones are available on M2's Crowd SiteIntel platform.

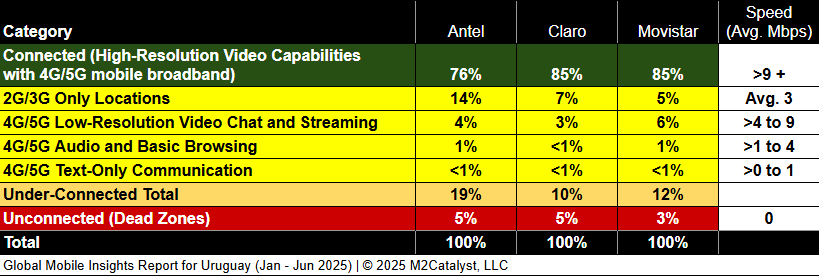
• Movistar and Claro each have a connected location percentage at 85%, while Antel has 76%.
• Claro has the lowest under-connected location percentage at 10%, while the other MNOs range between 12% and 19%.
• Claro has the greatest Dead Zone location percentage at 5% without rounding in our dataset.
Mobile Broadband Traffic:
How often are mobile phone users connecting on 4G, 5G-SA, and 5G-NSA, as opposed to connecting on 2G and 3G, or receiving No Signal whatsoever?
Unlike other mobile traffic metrics, M2’s analysis does not take payload into consideration because of its potential to bias the analysis (faster networks allow greater data flow). We focus solely on the percentage of measurements categorized by network connection type and the associated cell identities with those measurements from the M2 dataset. Our Cell ID counts are the count of unique Cell IDs by Mobile Network Operator (MNO), Network Type, and Country from our crowdsourced dataset.
Table 4: United Kingdom QoE Location Percentages by MNO
Key Findings for Table 4.
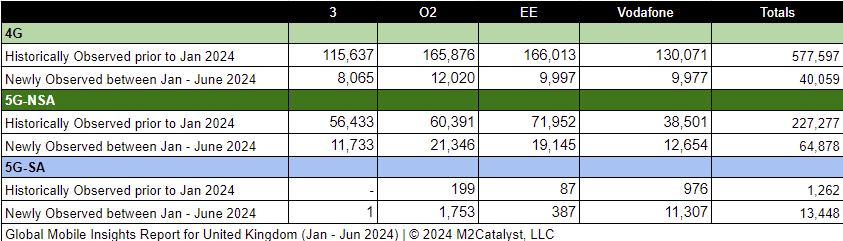
• Table 1 displays the number of unique Cell IDs newly observed between January and June 2025. As a reference, historically observed Cell IDs dating 18 months prior to December 2024 are also included. Newly observed Cell IDs can be attributed to either new hardware deployed by MNOs or an expansion in the footprint of our dataset.
• M2’s dataset for the 1st half of 2025 contains 76,892 newly observed 4G/5G mobile broadband Cell IDs. A more in-depth view of the Cell IDs and their associated details by location over time can be visualized on M2's Crowd SiteIntel platform.
• No significant progress has been detected towards increasing deployment on the 5G-SA network.
Your Next Step:
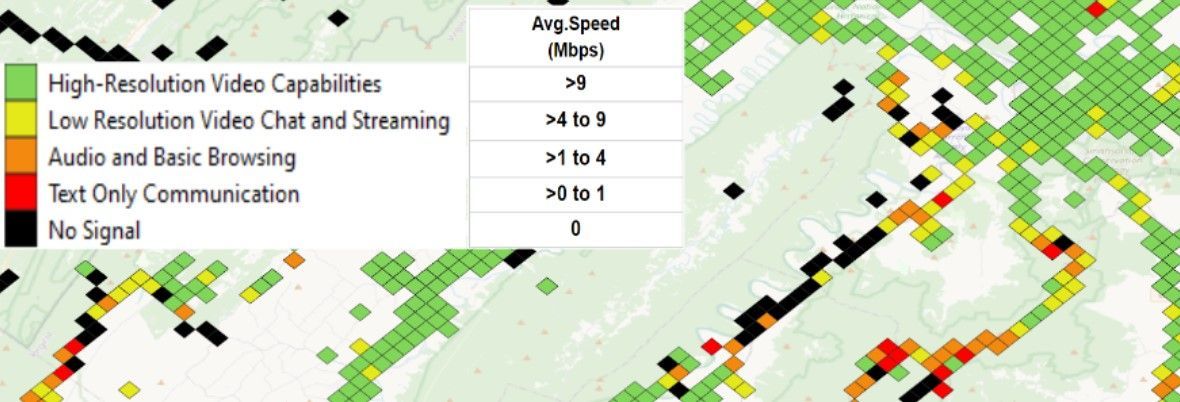

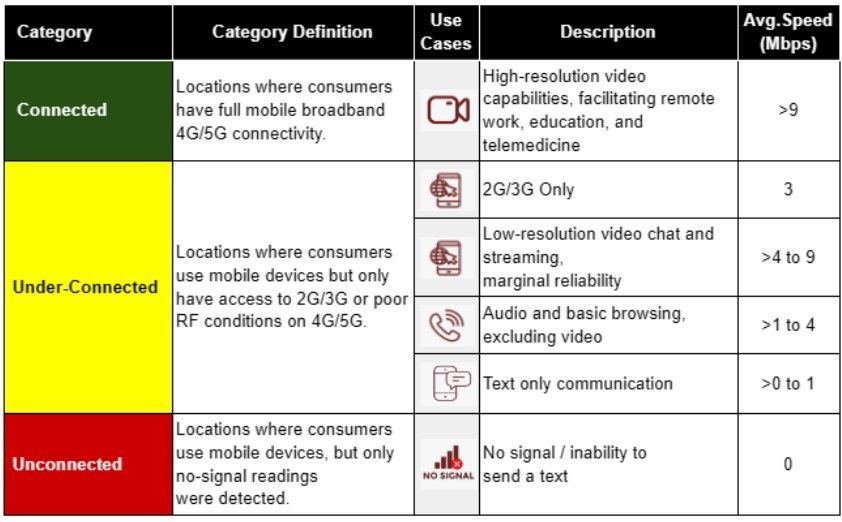
M2’s proprietary Mobile Broadband Quality algorithm comprehensively evaluates various factors, including signal strength, signal quality, and throughput, across (1) the 4G/5G service footprint for each country's national Mobile Network Operators (MNOs), (2) the 2G/3G-only service footprint for each MNO, and (3) areas where mobile devices are active but unable to detect any service. Within the M2 dataset, each 1km bin with mobile activity is then assessed to determine the highest mobile use case it can support, resulting in its classification as Connected, Under-Connected, or Unconnected.
Right to Republish M2 Reports
The M2 Crowdsourced Data, which has been developed, collected, aggregated, assembled, formatted, and supplied by M2 through the application of methods and standards of judgment developed and applied through the expenditure of substantial time, effort, and money, constitute confidential and valuable industrial property and trade secrets, and are protected by United States copyright laws and international treaty provisions as well as other intellectual property laws and treaties. All title and copyrights in and to the M2 Crowdsourced Data and any accompanying printed materials are owned by M2.
The M2 Crowdsourced Data may not be used as a component of or as a basis for any material offered for sale, license, subscription, or promotion.
M2Catalyst, LLC also retains full ownership of this M2 Mobile Broadband Quality report, encompassing all intellectual property rights, data, content, graphs, and analysis. Unauthorized quoting, reproduction, distribution, or publication for commercial use is prohibited without M2Catalyst's prior written approval. Journalists wishing to cite information from our reports must provide clear source attribution and secure prior written consent from M2Catalyst. For further information or clarification, please contact us at info@m2catalyst.com.
Learn more about the methodology for this report.